
How to Make Graph on Google Docs – Easy Simple Guide
 By
By
Google Docs and Google Sheets have proven an excellent substitute for Microsoft's Word and Excel applications. Although they are free to use, they lack several functions that Microsoft's products provide.
Regardless, most users believe both of these Google applications to be effective enough to handle their everyday activities. Adding graphs and charts to your text documents is one such activity. Unfortunately, you cannot use it for making a graph in Google docs; instead, you must use Google Sheets.
Why Do I Need to Use Google Sheets to Insert the Graph?
Graphs may appear to be static, yet they are highly dynamic. You have to enter the data and tell the app the method to produce the Graph.
As previously stated, this is the domain of Google Sheets. Simply enter your data into a spreadsheet, select it, and then make a graph.
How to make Graph on Google Docs on Mac, Pc, or Chromebook
Making a Graph or Chart in Google Docs

Creating graphs and charts to Google Docs on your computer is a simple procedure. The procedure is opening your Google Doc and a Google Sheets document, then merging them.
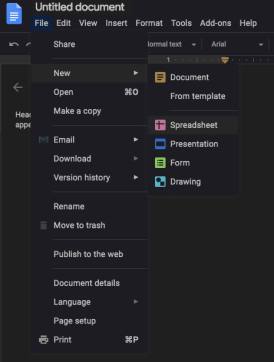
1. Open the Google Docs document to which you wish to add a graph. On the top menu, select the File option.
2. Select New, then Spreadsheet, and wait for a new Google Sheets file to open in the upper left-hand corner.
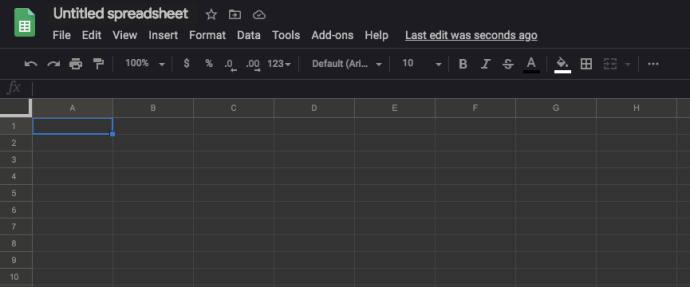
3. In Google Sheets, a new page will open; fill in the cells with the data you want to turn to a graph.
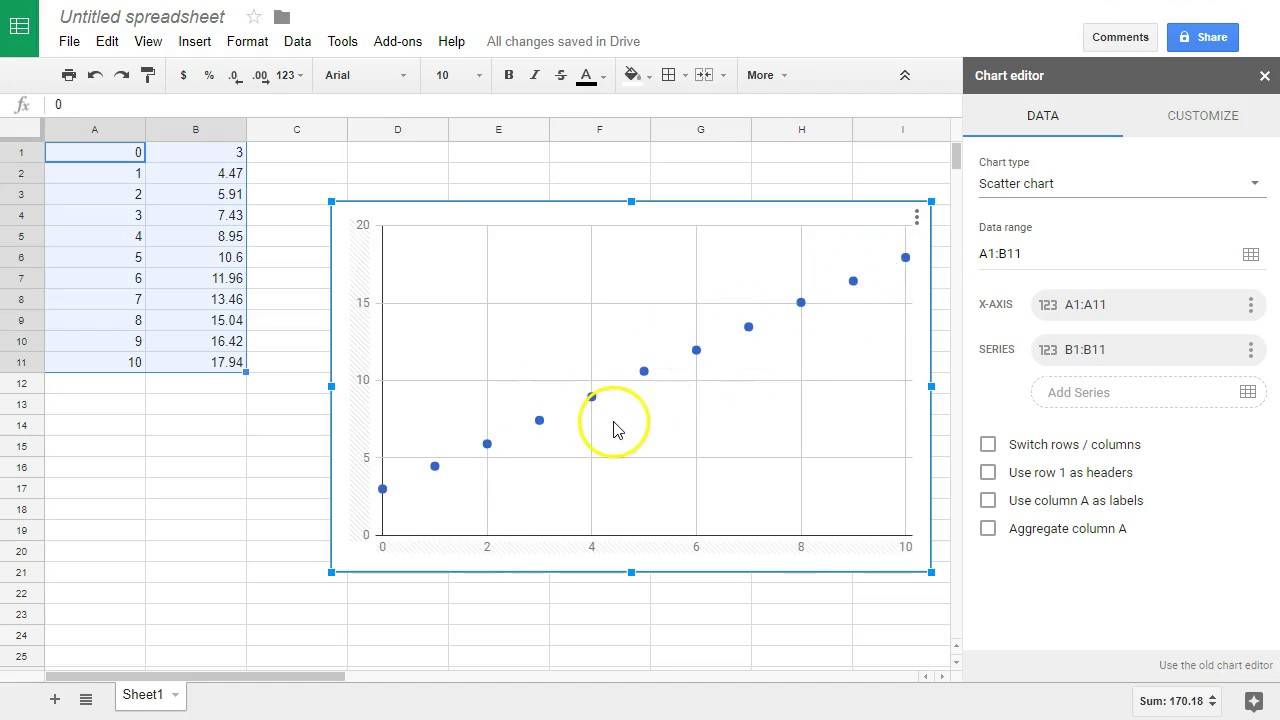
4. Select the cells holding your data and then, on the top menu, pick the Insert tab.
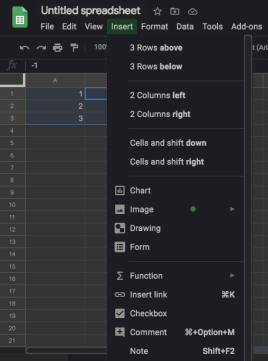
5. Then, choose Chart.
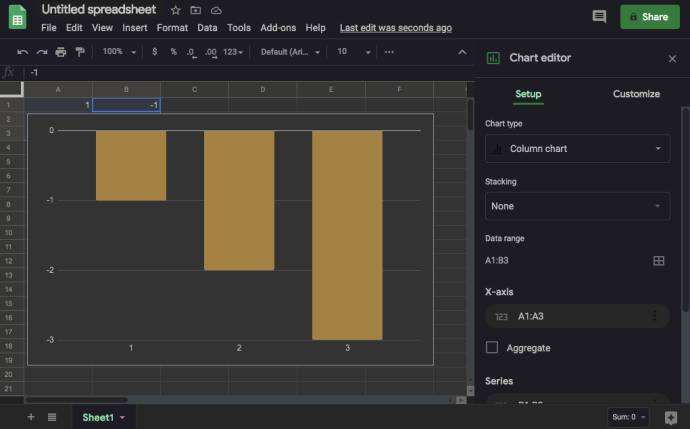
The Chart should now show in your spreadsheet automatically.
Copy Your Chart
You may also copy the data with your keyboard instructions. Users of macOS can utilize CMD+C, whereas Windows users can use CTRL + C.
You may also return to your Google Doc by selecting Insert > Chart. A From Sheets option is available at the bottom of the menu. Tap that, and your most current Graph will display (be sure to name it in Google Sheets, so it's recognized).
Paste your Graph
Go back to the Google Docs file and right-click the area where you want the Graph to appear. To add the chart to your Google Docs file, use your keyboard shortcuts. CMD+V should be used on macOS, whereas CTRL+V should be used on Windows.
Options for Pasting
A Paste chart menu will now display. You have two alternatives here: retain the spreadsheet connection or paste the Graph without tying it to the data. If you believe you need to modify the data points on the Graph, keep the connection.
You will be able to utilize the Graph to reopen and manipulate the spreadsheet containing the data. You may add, subtract, or simply alter some of the figures, and everything on your Graph will be instantly updated.
When you're finished, press the Paste button, and the Graph will appear in your Google Docs project.
How to make a chart on Google Docs
To change the chart type for a graph you've already placed in Google Docs, you must first access the Graph in Google Sheets. Begin by opening the Google Doc containing the Graph you wish to change.
1. Click on the Graph to make it more visible.
2. After that, click the link icon.
3. Now, click the Open source button.
4. After that, launch the editor and wait for the Google Sheets file to load. When it happens, click the Graph you wish to change. To open the editor, double-click the Chart or click the three vertical lines in the upper right-hand corner of the Chart.
5. Click the Setup tab, then the Chart type drop-down menu, found right below the Setup tab. Now, select the chart type that best fits your data.
6. In Google Docs, click the Update button.
If you chose to attach the Chart to your Google Doc, you would see an 'Update' tab. When you click that, your Chart will be updated with the changes you've made.
What Is a Line Graph and How Do I Make One?
1. Google Sheets will automatically choose the best chart type for your data. To convert it to a line graph, repeat steps 1–10 from above.
2. Then, in the drop-down menu, go down to the Line section and select the most appropriate line chart. In addition to the regular Line chart, the Smooth line chart may be used to smooth out the line to make it look continuous rather than joining each data point.
What Is a Bar Graph and How Do I Make One?
1. To get to the Chart Type menu, follow the same methods as in the previous two sections. Scroll right down to the Bar section and choose one of the three options: A bar chart, a stacked bar chart, and a 100 percent stacked bar chart are all examples of bar charts.
2. A bar chart is identical to a column, except that the time and quantity axes are inverted. The time is now on the x-axis, while the quantities are on the y-axis. A stacked bar chart merges all categories into one bar, with each color representing a different category.
Like the stacked bar chart, the 100 percent stacked bar chart combines categories into one bar, but the Graph now shows each category's portion of the total.
Changing the Legend
1. To change the legend of the Graph, first, go through steps 1 through 8 under Modifying the Chart Type.
2. Click the Customize tab and scroll right down to the Legend section after you've opened the Chart editor menu.
3. When you select it from the drop-down menu, you'll see a few alternatives. You may position the legend above, below, left, right, or even inside the Graph. You can also opt to delete the legend entirely by selecting None.
4. Following that, you may select the font type, size, color, bold, and italicize the description.
How to Make a Chart on Google Docs on an Android and iPhone
Adding a chart to a Google Docs file on a smartphone differs somewhat from doing it on a PC. Although you can make a chart with the Google Sheets mobile app, you cannot add it to the document with the Google Docs app. Instead, you must open your Google Docs project in a browser and insert the Chart you previously prepared in Google Sheets.
Before you start, ensure that you have both applications installed on your smartphone. Google Docs and Google Sheets may be found in the Google Play Store for Android users. Google Docs and Google Sheets are available in the Apple App Store for iPhone and iPad users.
The first step is to design a chart that will be included in your Google Docs file.
1. Launch the Google Sheets application.

2. Fill in the blanks in your spreadsheet with the data from the graphic.
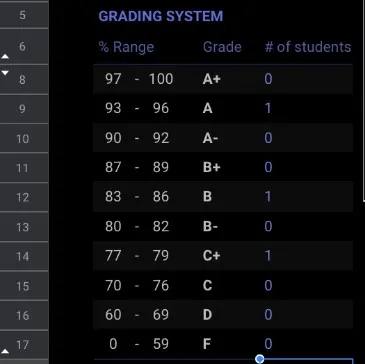
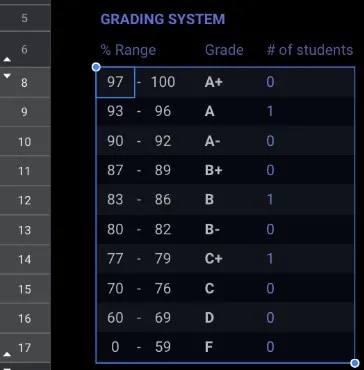
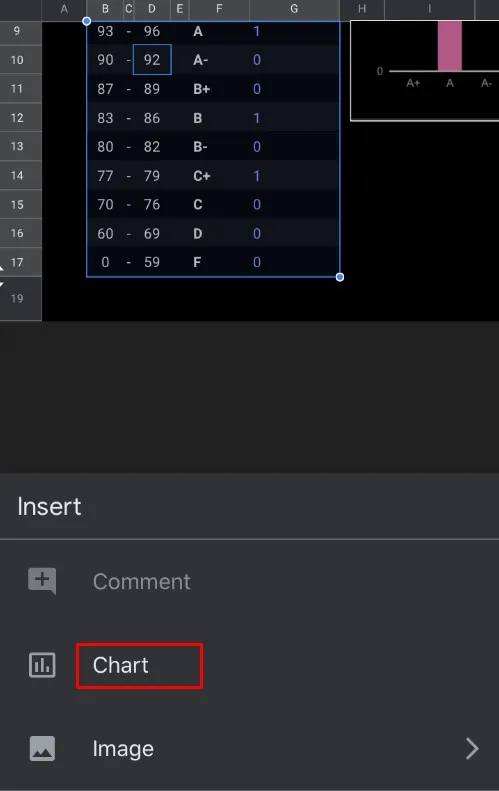
3. Select all of the cells containing the chart data.
4. In the app's top menu, tap the Plus symbol.
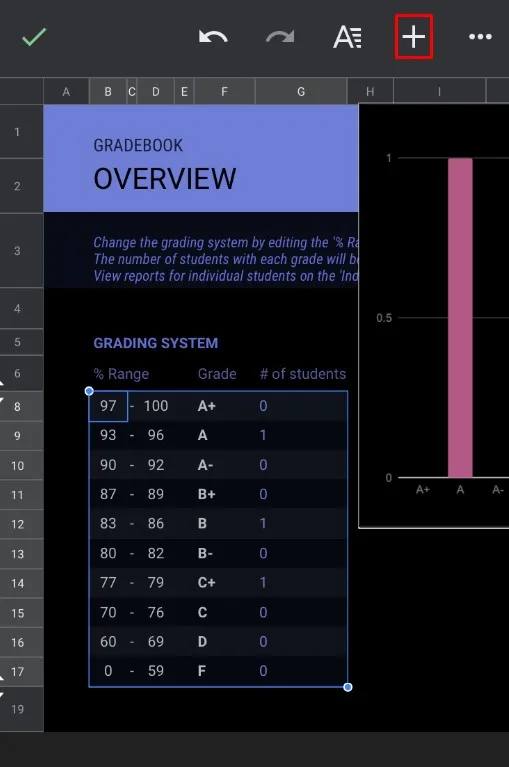
5. Now, choose Chart.
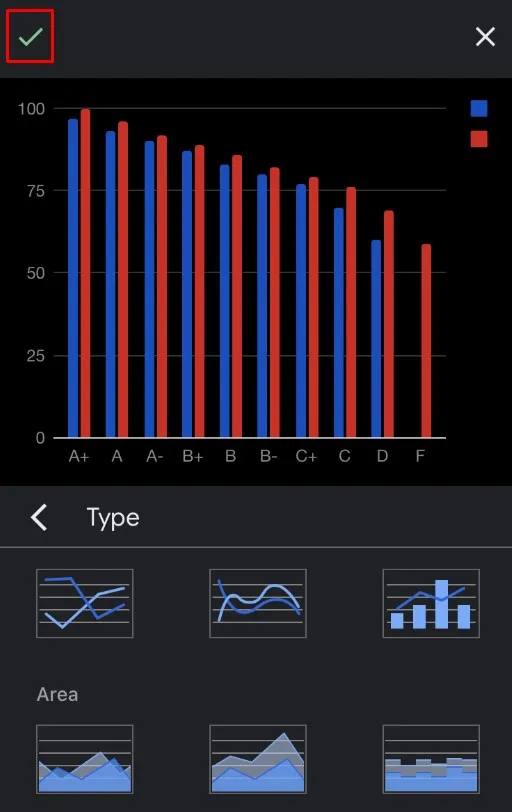
6. The software generates a chart for you automatically. You can alter the available settings if you like. When you're finished, save your Chart by tapping the checkmark symbol in the top left corner.
It's now time to add that Chart to your Google Docs file.
1. Using the Google Docs mobile app, create a document.
2. When you're ready, use your favorite browser and navigate to google.com.
3. You should now be on the main Google Docs page. Because it loads in mobile mode by default, a few choices will be missing. That is why you should open it in desktop mode.
4. Look for the option of Desktop site, Show desktop version, or anything similar in the browser's menu. If you select the box next to it, the website will refresh in the full desktop version. If your browser does not support desktop views, you may always use Google Chrome to accomplish this operation. It is only accessible for iOS and Android devices.
5. Tap anywhere on your paper where you want your Chart to appear.
6. From the top menu, select the Insert option.
7. Then, choose Chart.
8. Then, select From Sheets.
9. A pop-up window will open, listing all of your Google Sheets files, including charts. Select the one that contains the Chart you wish to insert.
10. Tap the Select button in the pop-lower-left up's corner.
11. Tap the Chart you wish to insert now. If your spreadsheet has more than one Chart, you will view all of them.
12. Tap the Import button in the pop-lower-right up corner.
13. Finally, the Chart will be shown in your Google Docs file.
Changing the Chart Type
1. You must also use the Google Sheets app to change the chart type.
2. On our smartphone, launch the Google Sheets app.
3. You will get a list of all of your spreadsheets. Select the relevant spreadsheet by tapping it.
4. When the spreadsheet opens, locate the Chart you wish to change and tap it.
5. Tap the Chart again to access the settings menu.
6. Select the desired chart type by going to Edit chart > Type.
When you're finished, press the checkmark in the upper left corner of the screen. The Chart's most recent version will be displayed in your spreadsheet.
You may now open your Google Docs file to view the revised Chart.
What Is a Line Graph and How Do I Make One?
1. Simply repeat steps 1 through 6 from the preceding section.
2. Choose one of the three possible line charts from the list of available charts.
3. When you're finished, press the checkmark in the upper-left corner of the screen, and you're done.
What Is a Bar Graph and How Do I Make One?
This procedure is similar to the previous two instances, except selecting the chosen bar graph.
Changing the Legend
1. The Google Sheets mobile app only enables you to move the legend relative to the Graph. To do so, go through steps 1 through 5 under Modifying the Chart Type and then choose Legend from the menu.
2. Select one of the alternatives and touch the checkmark in the upper-left corner of the screen.
FAQs
1. Is it necessary to utilize Google Sheets to generate a graph in Google Docs?
Yes, Google Sheets is the only way to enter data for your Graph. Although you may construct a graph with Google Docs, the data in the Graph will be generic. As a result, to update the data, you must first access the Graph's source, which is a Google Sheets file.
2. Is it possible to modify the default chart type?
Unfortunately, there is no way to modify the default chart type because there isn't one. Google Sheets will automatically select the chart type to use depending on the data.